CMS is increasingly moving to alternative payment models whereby providers are paid based on their ability to improve/maintain quality and hold the line on cost. A key question then, is how does CMS evaluate quality of care? Today, the Healthcare Economist will answer this question for the case of Medicare’s Shared Savings Program (MSSP), which is an alternative payment model for accountable care organizations (ACOs).
How were ACOs scored based on quality in 2014?
As outlined in McDowell et al. (2018):
In 2014, the Centers for Medicare and Medicaid Services (CMS) grouped 33 quality measures into four domains based on clinical relevance and generated domain-level scores. An ACO’s domain score, equally weighted across the six to eight measures in each domain, was used to identify low-performing ACOs in each domain. Overall scores were obtained as equally weighted averages of the four domains.
How is quality measured for ACOs in 2018 and 2019?
Well, first, quality depends not only on an ACO’s quality level (i.e., attainment score), but also the degree to which an ACO has improved their quality from the previous year (i.e., improvement score). ” ACOs are rewarded up to four additional points in each domain, if they demonstrate quality improvement.” Like previous years, individual quality scores are aggregated into domains. As outlined in CMS documentation:
CMS will measure quality of care using 31 quality measures (29 individual measures and one composite that includes two individual component measures). The quality measures span four quality domains: Patient/Caregiver Experience, Care Coordination/Patient Safety, Preventive Health, and At-Risk Population.
There are 8 measures for the Patient/Caregiver Experience domain, 10 measures for the Care Coordination/Patient Safety domain, 8 measures for the Preventive Health domain, and 5 for the At-Risk Population domain.
How are ACOs scored on each measure?
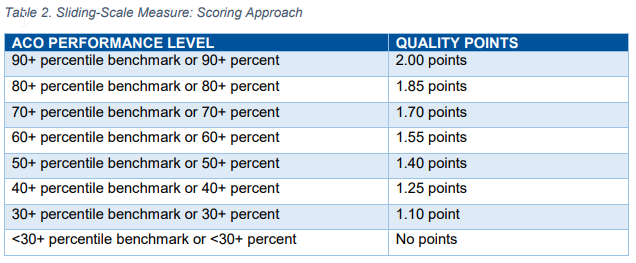
…performance below the minimum attainment level (the 30th percentile) for a measure will receive zero points for that measure; performance at or above the 90th percentile of the quality performance benchmark earns the maximum points available for the measure.
For ACOs performing between the 30th and 90th percentile, points are assigned as follows for most measures.
Note however that there are some metrics which are always pay-for-reporting.
Is CMS domain definitions valid?
McDowell et al. (2018), examine this question, in part by applying exploratory factor analysis (EFA). Whereas CMS uses clinical logic to define their domains, EFA groups measures empirically based on how closely they are correlated with one another. EFA assigns measures to domains based on what the highest loading factor is. The EFA analysis also explores varying weights both within domains and across domains. The authors also test what happens if measures are weighted by their variability (mathematically defined as their eigenvalues), which allows for more statistical power to differentiate quality across ACOs. The authors use Cohen’s kappa statistic to quantify the agreement between CMS quality score and the various alternative quality scores proposed in this paper through different grouping and weighting approaches. The authors also test the share of ACOs who’s financial reimbursement would change by more than ±5% or ±10%.
Using this approach, the authors founds that:
Among CMS domains, ACO performance was highest (relative to benchmarks) and least variable in the Patient/Caregiver Experience domain…ACO performance was highly variable in the At-Risk Population domain…The internal consistency of each of the CMS domains ranged from a = 0.13 for Care Coordination/Patient Safety to a = 0.83 for Preventive Health; whereas the internal consistency of the empirical domains from the four factor model were generally higher by construction…When using the empirical domains, equal weights within the domains and equal weights across the domains, 22 percent of ACOs experienced >|5| percent difference in overall quality score and 3 percent of ACOs experienced a >|10| percent difference in quality score (Figure 1b).
Generally, the authors claims that there is “substantial agreement” between the CMS approach and the authors’ data-driven approaches. While the authors ex-post approach is more rigorous, it is infeasible to implement in practice since ACOs need to know the scoring/weighting system ahead of time to plan their quality strategy. Further, the CMS clinically based approach is easier for most ACOs to understand. This broad consistency, in short, should be seen as a re-assuring finding.
Source:
- McDowell A, Nguyen CA, Chernew ME, Tran KN, McWilliams JM, Landon BE, Landrum MB. Comparison of Approaches for Aggregating Quality Measures in Population-based Payment Models. Health services research. 2018 Aug.
How Medicare measures quality for ACOs posted first on http://dentistfortworth.blogspot.com

No comments:
Post a Comment